Investor psychology is a fascinating subject. There’s no better place to observe this tug of war in markets than the Fear and Greed Index. The CNN Money Fear & Greed Index doesn’t make predictions.
Still, by using its seven indicators, it’s a useful tool for investors to better understand which market forces are currently dominating.
Whenever you hear people making speculation and predictions about what will happen in markets, I would advise you to grab your money and slowly back away.
Next, run as fast as you can in the opposite direction. Once you are in a safe place away from all the prognosticators and future tellers, collect your thoughts.
The Fear and Greed Index
There’s plenty of data giving investors a chance to make their own informed decisions. Some are better than others. Let’s look at a few market indicators and go beyond the CNN Fear & Greed Index.
While it’s not a great idea to think you can predict what will happen in markets, one thing you should know is where we stand today and where we’ve come.
Two emotions, fear, and greed, primarily drive investors. When investors are greedy, the prices for assets can get bid up way beyond a reasonable and fair price.
Emotional Investors
When there’s too much fear in markets, prices can sink below fair value. Investors see red numbers and panic. Great deals can be had when prices move below intrinsic values.
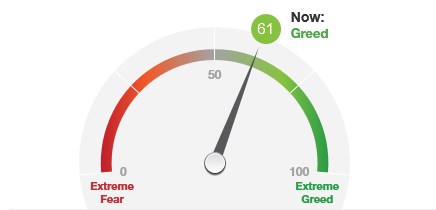
An interesting index I’ve watched is the CNN Money Fear & Greed Index. This is not a predictor of the future and certainly not investment advice or a trading device for timing markets.
It’s merely an index showing a market trend, combining seven useful indicators of an investor’s appetite for risk. A lack thereof can be informative, as well.
7 Indicators of the CNN Money Fear and Greed Index
The CNNMoney’s Fear & Greed Index looks at seven market indicators. Each indicator is tracked for how far from their average to detect current market sentiment.
The index uses a scale from 0 to 100. The higher the reading, the higher the greed of investors, with 50 as neutral.
Back in the depths of hell during the financial crisis in September of 2008, the index rang in at a fearful 12. Later, when cooler heads would prevail, the economy began to recover in 2012.
Stocks and markets, in general, began to go on an epic run. The CNN Fear & Greed index would skyrocket to the upper 90’s.
How Do You Gauge Fear and Greed?
So what goes into a simple gauge of investor emotion? You could choose hundreds of indexes and indicators to show the everyday ebb and flow of money in global markets.
CNNMoney’s Fear and Greed chose seven indicators to blend into their index recipe.
Some folks like to use the Fear and Greed Index as a contrarian indicator; others want to look at specific components inside the index.
Whatever your purpose might be, the Index can offer a fascinating insight into the current state of the markets.
Of course, it should never be used as a trading tool for short-term market timing. Markets are a gamble, let’s be clear. Always consult your investment professional and do your own research before making investment decisions.
Now that we have the disclaimer out of the way, let’s take a closer look at each component.
Stock Price Strength
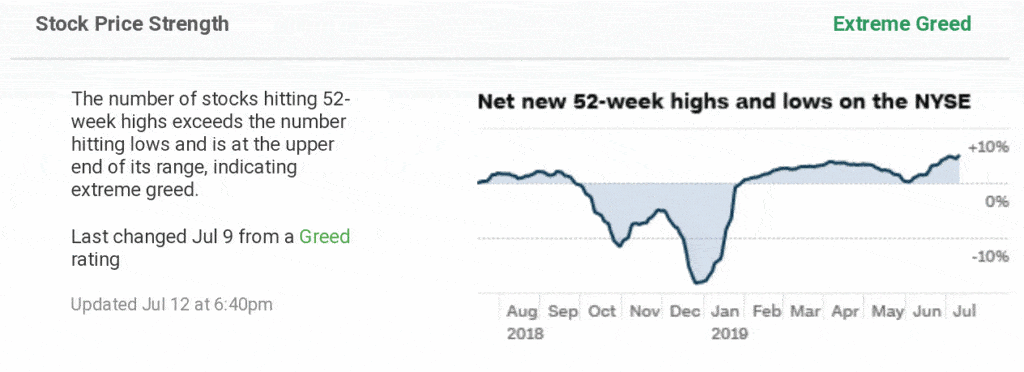
Looking at Stock Price Strength is the number of stocks on the New York Stock Exchange hitting their 52-week highs.
If more share prices are hitting new highs than stocks hitting new lows, it would indicate greed in the markets.
At the moment, there are 165 new 52-week highs on the NYSE and only 23 new 52-week lows. You can find the complete list of companies here.
As you can see in the chart above, the index is in Extreme Greed territory. The NYSE is showing stock price strength in the short term also.
Market Momentum
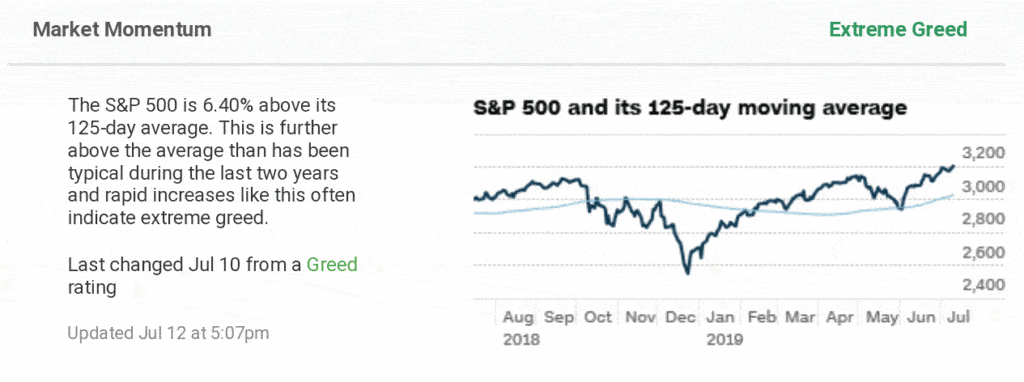
The Market Momentum is the S&P 500 index versus its 125-day moving average. This is simply how far above or below stocks are from their not too distant past.
The higher the S&P index moves above the 125-day moving average values, the higher the stock price momentum indicates on the CNN Fear & Greed Index rating.
On the other hand, when fear strikes – the S&P plummets. When the index drops below the 125-day moving average, the lower score will compute the fear level into the Fear Greed Index.
The index also breaks down the most recent analysis and gives the previous reading and the date the last reading occurred.
Safe Haven Demand
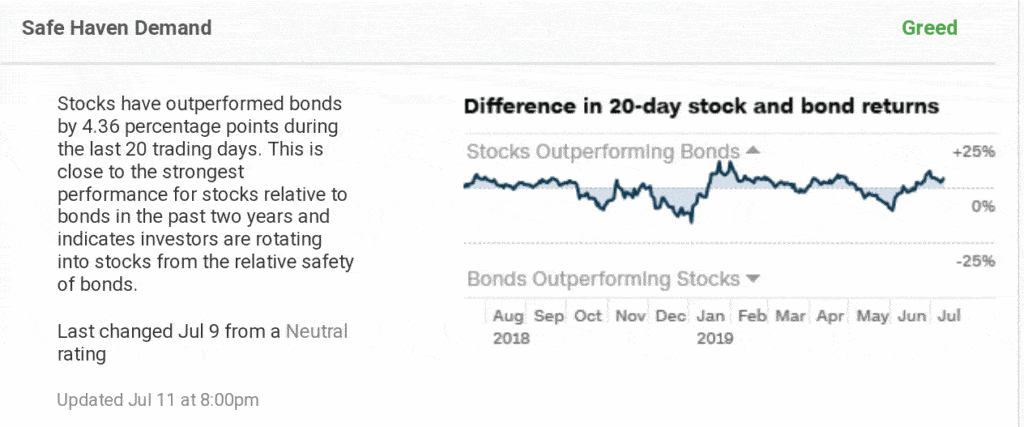
By measuring Safe-Haven Demand, investors can visualize the difference between 20-day stock and bond returns.
When stocks outperform bonds over the last 20 days, it indicates an appetite for riskier assets. A more greedy atmosphere in the financial markets is underway.
Bonds are considered a safe haven. When fear strikes, or a recession is near, bonds are more desirable. Selling stocks and buying bonds, that’s the tell-tale sign of potential trouble ahead in markets.
At the current reading, stocks are outperforming bonds. At nearly the strongest margin over the last two years, there’s more greed and less extreme fear in general.
In times of market turbulence, a safe haven is an investment that retains or increases its value. You may be asking yourself why bonds are considered safer than stocks, and the answer is not always clear.
One of the most common solutions would be that corporate bond coupon payments are considered more stable than company dividend payments.
Put and Call Options
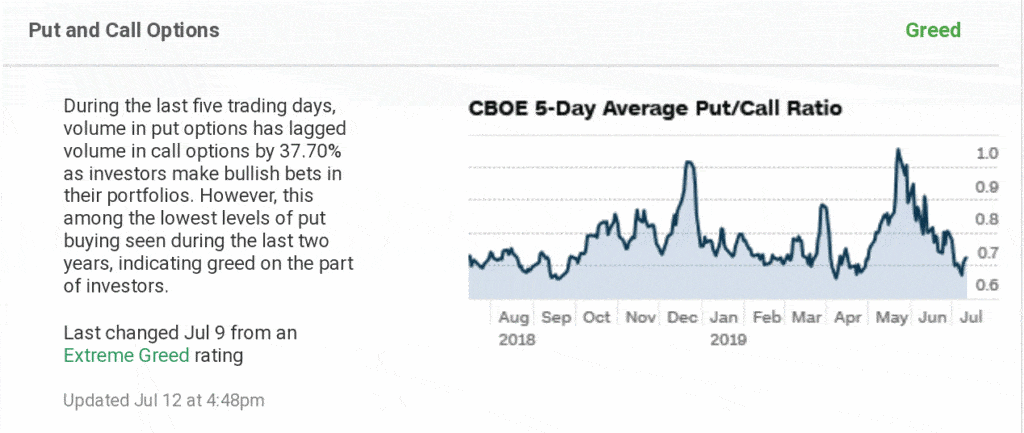
Another useful indicator in markets for gauging optimism or pessimism at a given time is the Put to Call Ratio. The CBOE 5-day average put/call ratio tracks the daily volume of options purchased.
The put/call ratio indicates investor sentiment among traders. This ratio is known as a contrarian measure.
Too many call option buyers would signal a market top may be in the making. If traders buy too many put options, the possibility of a market bottom is more likely.
A helpful exercise is to look at results of a long term chart showing the Put/Call Ratio to see where the index registered at market extremes.
One thing to keep in mind is that historically the option index has been skewed toward more put buying than call buying because of hedging by portfolio managers.
At the current reading, the volume of put options has lagged the volume of call options by over 37%. This happens to be the lowest level of put buying over the last two years, showing greed in markets.
Stock Price Breadth
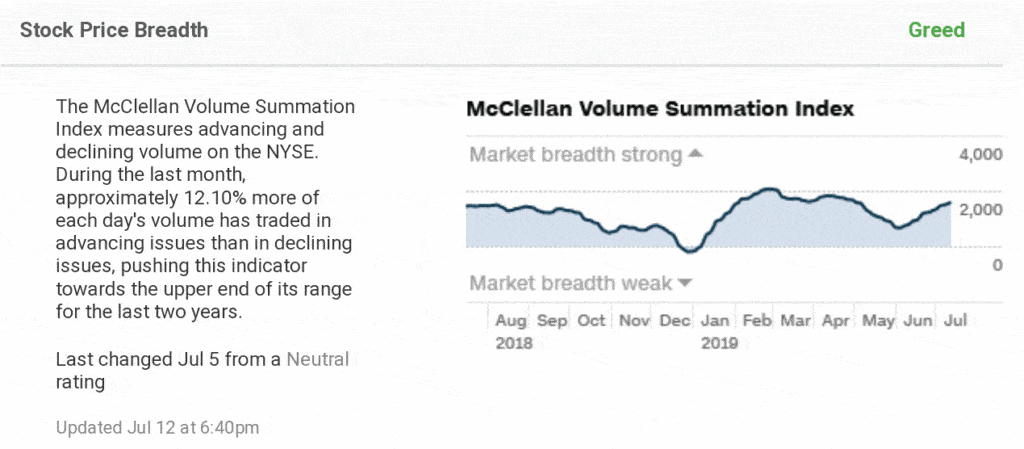
The Stock Price Breadth component shows volume in advancing stocks relative to declining stocks.
The McClellan Volume Summation Index tracks the advancing and declining volume of shares on the New York Stock Exchange over the last month.
It indicates strength or weakness in overall market breadth. High buying volumes move the index higher, while high selling volumes move the index lower.
Over the previous month, 12% of each day’s volume on the NYSE has traded in advancing issues rather than declining issues.
The rising volume of advancing issues is important market information. It shows an appetite for greed over fear across the entire stock market.
Market Volatility
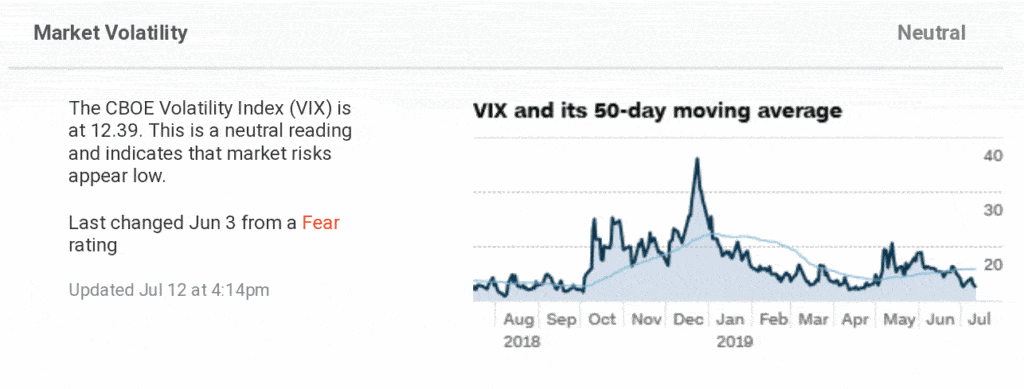
This measure of share price volatility aims to gauge sentiment using options. The VIX, along with its 50-day moving average, can reveal extreme fear among investors.
It’s the expectation of market volatility implied by the S&P 500 index options and calculated on a real-time basis by the Chicago Board Options Exchange.
If the VIX, or Volatility Index, shows higher levels of current volatility above its 50-day moving average, investors’ fear is usually increasing.
If the index falls below its 50-day moving average, the market is showing a less fearful atmosphere.
Market crashes and panics have coincided with a spike in the VIX to extreme levels. This would indicate the height in investors’ fear and market volatility.
Note that many of these indicators use the S&P 500 rather than the Dow Jones Industrial Average, which is only 30 stocks.
Junk Bond Demand
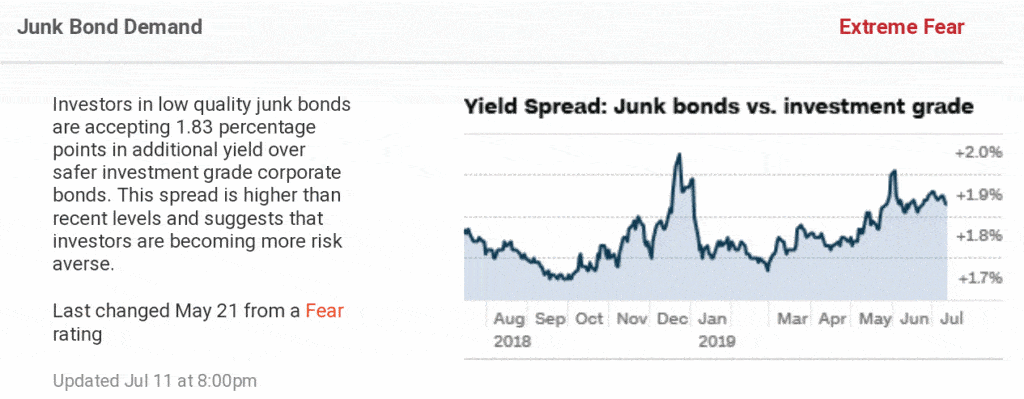
When investors look to riskier investments like junk bonds, it can indicate a greedy atmosphere. The Yield Spread tracks junk bond demand vs. investment-grade corporate bonds. Buyers receive a higher yield for junk bonds.
The reason being the risk of default is higher for junk bonds relative to investment-grade bonds.
When the yield spread falls, it shows an appetite for risk. Investors are less worried about default and greedy for higher returns, causing them to accept less compensation for more risky junk bonds.
A fearful market would demand a much higher yield on junk bonds. This is relative to investment-grade bonds and therefore sends the yield spread higher.
Sometimes, the Federal Reserve will have ideas on where inflation might be headed, and want to cool it down. Through interest rate policies, central banks will increase interest rates and attempt to slow inflation.
Market Emotions and The Fear & Greed Index
You hear the words fear and greed in investing almost more than any other combination of words.
Warren Buffett did an excellent job promoting the phrase when he said, “Be fearful when others are greedy and greedy when others are fearful.”
He mumbled these words probably around the time of his first television interview back in the mid-1980s, and the phrase has been gaining popularity since then.
Markets can swing from fear to greed many times throughout a given year. Everything is a trade in the short-term. But over the long term, patterns emerge where investors let their emotions make decisions for them.
The chart below shows a clear portrayal of a full cycle of market emotions. Beginning with optimism and excitement, prices are bid up, things look safe, and profits are easy.
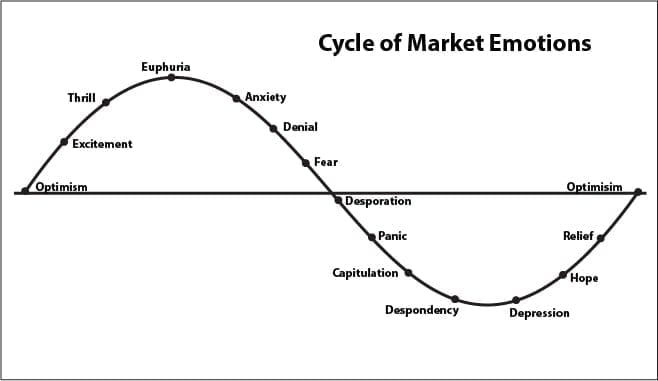
Good news and easy profits lead to thrill and eventually euphoria as everyone is convinced the good time will never end. Markets reach all time highs, and fear has evaporated. The high point is marked by extreme optimism.
Often, there is so much greed at the highest levels of the cycle; it’s difficult for anyone to detect. Everyone is intoxicated with extreme market emotions.
As thoughts turn, anxiety grows, and there’s a denial that the good times are over.
Astute investors recognize the signals of market trends and capitalize on a good opportunity to take advantage of high or low prices.
Investor Emotions and Market Turning Points
As the market continues to fall, fear sets in, and desperation becomes panic. Primary emotions take control at the extremes where capitulation and despondency are widespread.
Markets now acknowledge that things are bad with no end in sight.
Depression sets in among market participants, where the thought of higher stock prices seems impossible.
This is where recovery is born, and there are no more sellers to be found.
The turning point begins, and hope is renewed. Some relief and soon after, a touch of optimism can be found where the cycle is now complete.
The cycle of market emotions happens over and over, year after year, decade after decade.
Whether it’s stocks, bonds, cryptocurrencies, rare coins, or collector cars, as long as people participate in markets, there will be a similar cycle in the years to come.
You can see these patterns repeat over and over in other similar indexes such as the Bullish Percent Index (BPI) and even in bitcoin and the crypto market with the Crypto Fear and Greed Index.
Why Do Stocks Fall Faster Than They Rise?
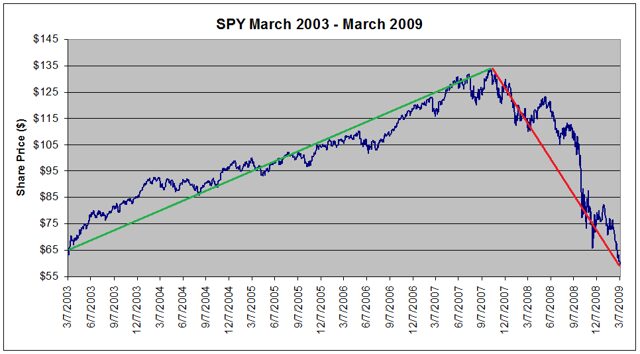
Generally, stocks will fall in price faster than they rise. There’s a variety of different factors that cause selloffs to happen quicker than gains.
One of the primary reasons the stock market declines faster is because of leverage.
Some investors buy stocks with borrowed money, and when stocks decline, some are forced to sell to meet mandatory margin calls demanded by the brokerage houses.
If investors do not sell to meet the margin call, the broker will sell automatically for them.
The Human Factor
Another reason stocks fall faster than they rise is due to human emotion. Gains in stocks are enjoyed over the long-term, hypothetically. We get accustomed to watching these gains month after month, year after year.
We are almost trained to expect our money to grow over time in the stock market, on a long time horizon. You can see this long-term performance on a weekly chart.
The sharp drops in CNNMoney’s Fear and Greed index also show this sharp drop on the downside.
Emotions Deep Within the Brain
The human emotion factor plays a part in stock market declines because the loss of money can be more than the gains. People tend to panic sell to avoid this pain.
Watching your gains evaporate is considered by many, and studies have shown this to be more painful than market gains.
A recent study published in the Journal of Neuroscience showed that losing money activates an area in the brain involved in fear and pain.
Effects of Winning and Losing
Researchers used MRI brain scanners to monitor healthy adults playing a gambling game and how they reacted to winning or losing.
Deep within the brain, an area called the striatum attempts to predict the chances of winning or losing money.
Scientists called this act the “prediction error,” where the brain learns to predict based on previous mistakes.
Behavioral Finance and Fear & Greed
The study of behavioral finance focuses on psychological factors that impact market outcomes and how people make investment decisions. This fascinating field is broad and covers a huge variety of topics.
Research in this field is just getting started. Much of it can explain why the stock market falls faster than it rises. It’s due to human psychology and our own emotional overreactions to gain and loss.
The fear of losing money is much bigger than the excitement of gains. This pattern has been observed over and over.
Not only is the pain of loss something investors fear, the pain of accepting they have made a bad decision is almost as painful.
With the human brain wired with certain biases, markets tend to react quickly to this fear and pain.
Google Trends Data and the Fear and Greed Index
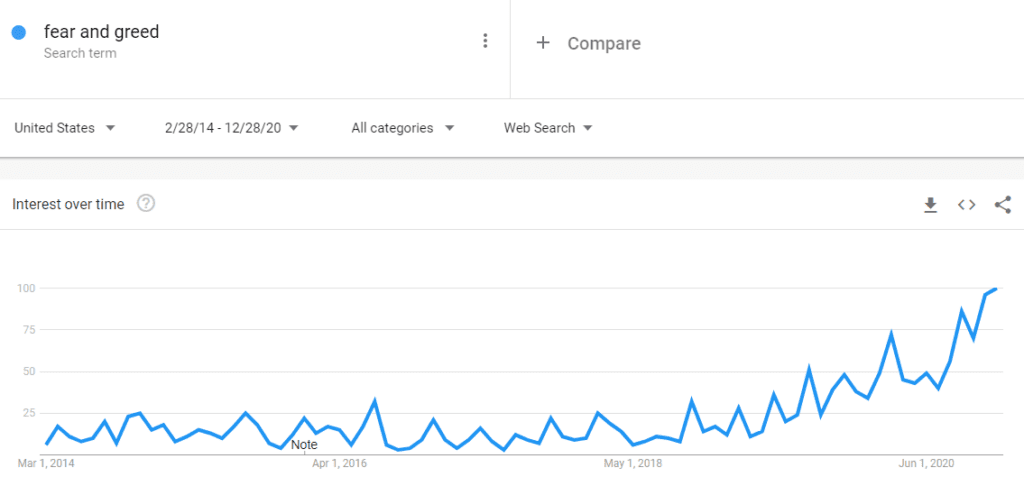
One of the best ways to view trends around the world is using Google Trends Data. If the Fear and Greed Index measures market sentiment, then Google Trends measures World Sentiment.
It’s a fascinating way to discover the popularity levels of various search terms around the world over time.
Stock Market Crashes
What’s with all the fear, anyway? Maybe you’re new to the market and wondering why everyone is constantly talking about fear and greed. It’s O.K. – you might not have experienced a market crash.
Living through one of the biggest crashes in stock market history tends to stick with you for a while. There have been several major market crashes in the last 100 years or so.
1929 Market Crash
The stock market lost 89% of its value from 1929 to 1932. It took 22 years to regain its pre-crash value. If you’re wondering why investors fear a downturn, this is what they are fearing. 22 years of investing pain.
1987 Black Monday Crash
The Black Monday crash of 1927 was unique. Not one wall street guru could tell you what exactly led to the 22% plunge on a single trading day.
October 19, 1987, will be remembered for one word – fear. Panic quickly spread from one investor to another, quicker than anyone’s seen before.
1999 – 2000 Dot-com Crash
The late 1990s saw a huge run-up in stock prices. Investors were feeling greedy, to say the least.
The signs of a bubble were everywhere. New “Dot-Com” companies were trading with insane valuations.
Even if you believed stocks were overvalued, you had to buy. Everyone was buying and making a fortune. Do you want to be the only one not getting rich??
This thought process led to the Dot-com crash. The NASDAQ index lost 76% of its value over the next year.
2008 Great Financial Crisis
Most people remember the Financial crisis of 2008. Real estate could only go up – remember that? Classic bubble conditions where greed was in full effect.
It quickly turned to fear. The Dow would lose 54% of its value, and the global economy went to the brink of collapse.
Will History Repeat?
I have no idea what will happen in the future – obviously – but if you’ve never seen fear in markets, I will bet you will have your day.
The timing of market cycles can’t be predicted. But what can be expected is human behavior and emotions playing a role.
This is what makes watching the fear and greed index fascinating. Wherever there are free markets and many participants buying and selling, fear and greed will be at work.

